Contributors

Joe Seydl

Senior Markets Economist

What have we learned about inflation in the past few years – and how can these learnings guide investor outlook?

The pandemic-driven inflation shock is ending, as inflation rates in 2024 look likely to take a glidepath toward central bank targets. It’s a good time to reassess the lessons we learned, with the goal of becoming better inflation modelers.

It’s not merely an academic matter: Soaring inflation can damage both stock and bond performance, as investors were reminded in 2022.

We believe inflation is moving steadily lower. Our base case macro outlook sees moderating economic growth and cooling inflation, which is likely to continue to be supportive for both stock and bond returns. It’s now clear that the forces that drove inflation during the COVID pandemic – fiscal stimulus, supply chain disruptions, consumer spending skewing toward goods, and low labor force participation – have mostly proved temporary.1

But we acknowledge that resurgent inflation poses a key risk to our outlook. If inflation takes off again, investors could revise their expectations for central bank policy and, once again, increase the risk that it could take a recession to eradicate inflation. In such an environment, both stocks and bonds could struggle.

We don’t believe you need to fear excessively that inflation will re-accelerate in the next couple of years. But we do believe it’s important to have a framework for anticipating inflation’s path. To that end, in recent years we’ve made enhancements to our traditional models.

Here, we present five key takeaways from our latest analysis:

1. Unemployment is a less useful indicator

Wages, of course, are central to the inflation puzzle, closely watched by economists to detect any sign of the dreaded “wage-price spiral.” In traditional economic models, a lower unemployment rate – linked to higher wages – implies greater inflationary pressures. But in recent years, the unemployment rate told us little about inflation’s trajectory.

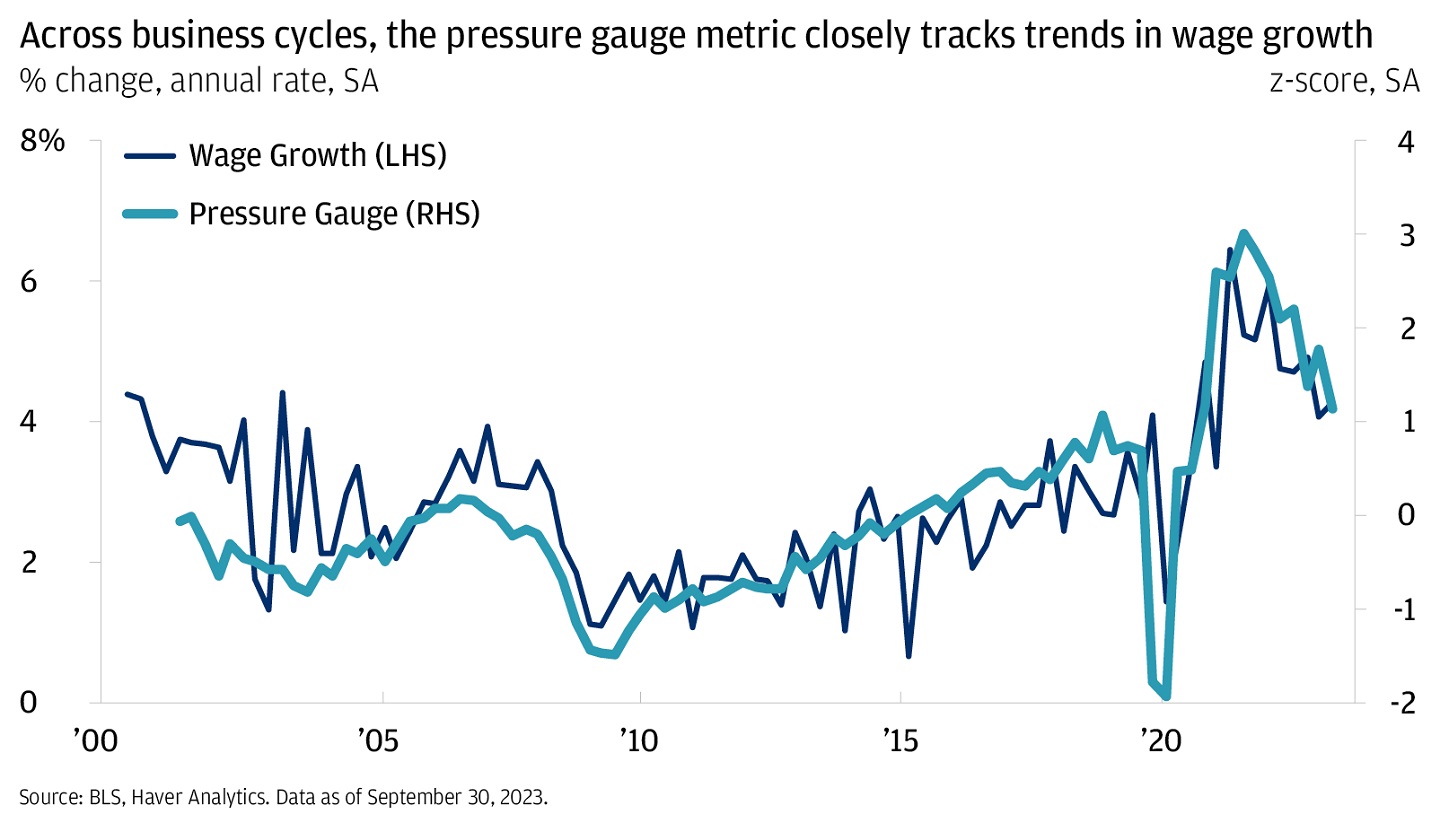
What data can we track to better understand if inflationary pressures are building in the labor market? The so-called “pressure gauge,” defined as the quits rate divided by the layoff rate, is one of our favored metrics. It explained three-fourths of the variance of wage growth in our analysis, while the unemployment rate explained only half of the variance.

The chart describes the annual % change for wage growth and z-score for pressure gauge.

The current signal from the pressure gauge finds a labor market only modestly tighter than in 2019. That’s consistent with underlying inflation rates of 2%–2.5% (i.e., modestly higher than the inflation of 2018–2019).

2. Shelter inflation moves with important time lags

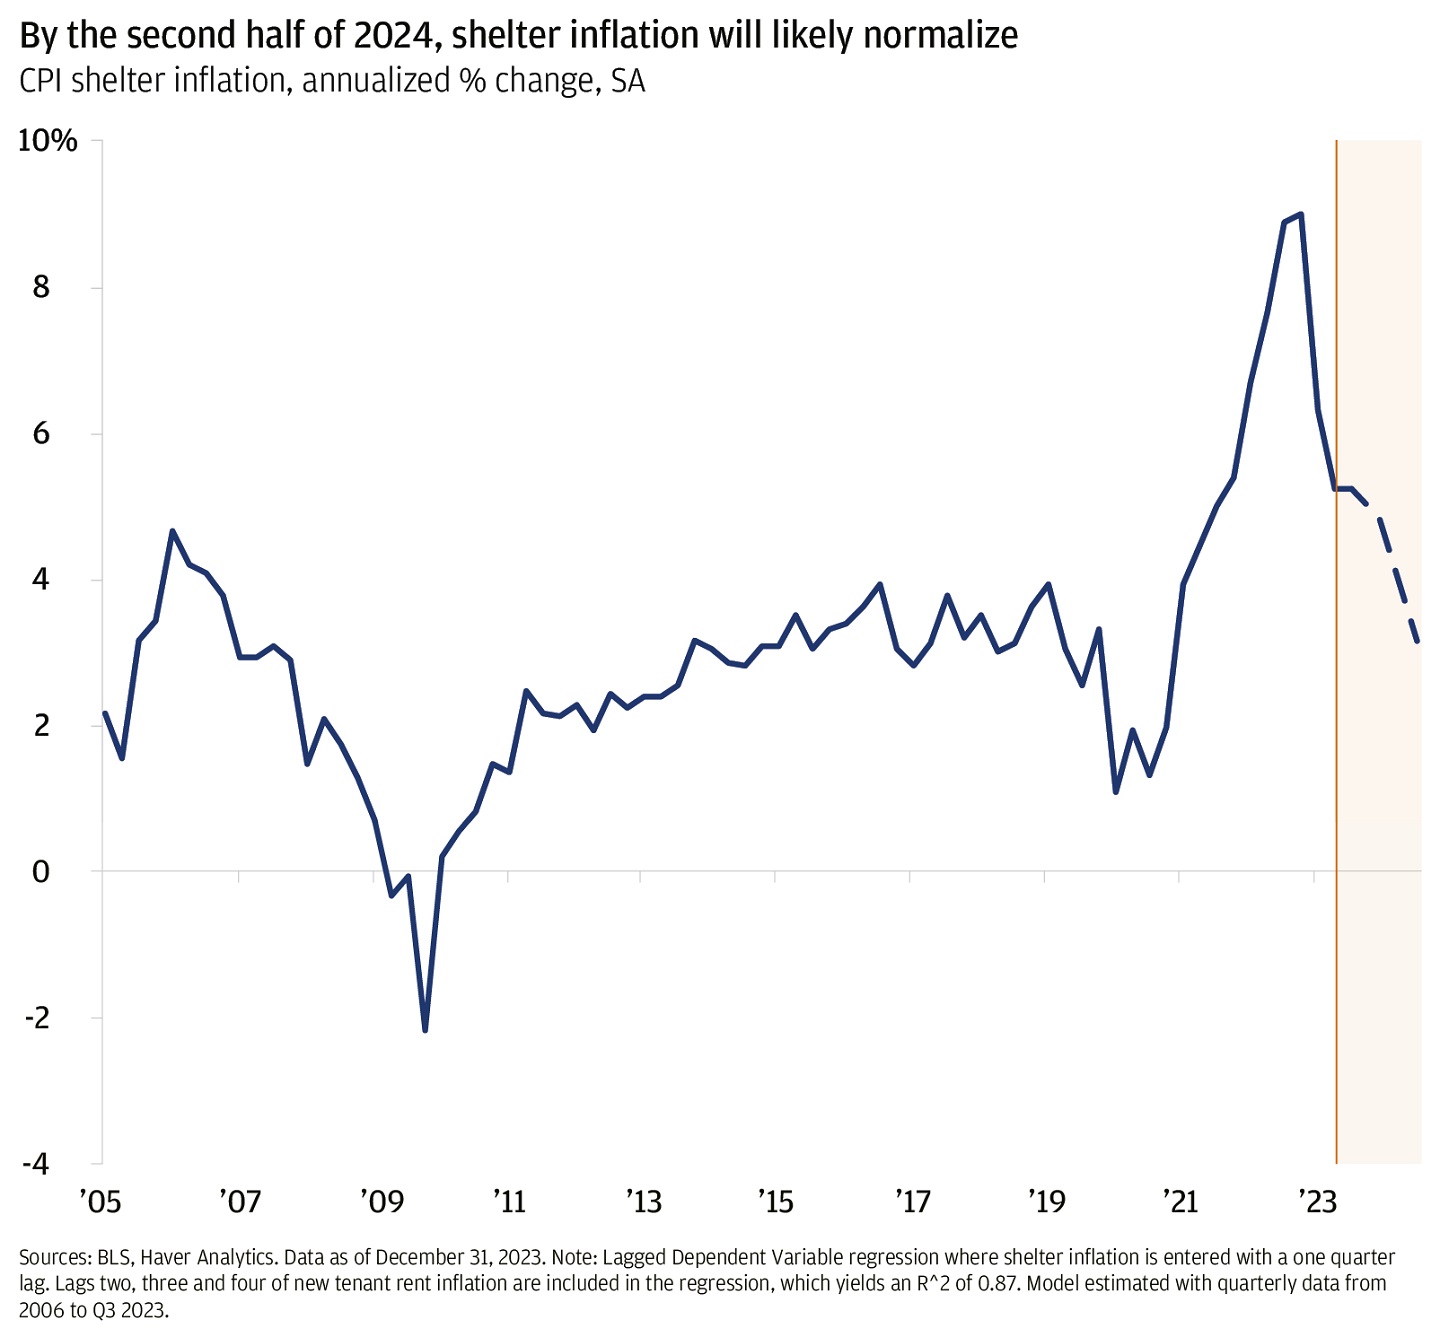
Shelter inflation (from the housing market) has long been a key component of U.S. inflation, accounting for 34.4% of the Consumer Price Index (CPI) and 15.5% of Personal Consumption Expenditures (PCE) inflation.2 But during the pandemic, we learned that shelter inflation, which measures the average cost of housing, is slow moving and lags new housing rental contracts that are tracked on a monthly basis. Bureau of Labor Statistics research suggests shelter inflation lags new tenant rents by about four quarters.3

Understanding the time lag allows us to anticipate a shelter inflation trend over the next four quarters using new tenant rent data. In 2024, shelter inflation is expected to slow to a rate comparable to where it was in late 2019.4 In 2025, shelter inflation presents more of a risk. But now that we better comprehend how rental inflation pressures can build well before they appear in the official data, we are better prepared to manage that risk.

The chart describes the annualized percent change of shelter inflation.

3. Old supply-and-demand models failed spectacularly

Pre-COVID, economists typically used variables such as the U.S. dollar exchange rate and food and energy prices to model the impact of supply shocks on inflation. But these variables failed completely to capture the magnitude and breadth of the COVID-era supply-side disruptions. These included semiconductor shortages, shipping backlogs at ports and lumber shortages caused by plant lockdowns.5

The New York Federal Reserve’s Global Supply Chain Pressure Index (GSCPI), created during the pandemic and now updated monthly, did a much better job in capturing the supply chain disruptions. More recently, the GSCPI has normalized, consistent with continued inflation normalization in 2024. If the GSCPI does especially well identifying supply-side inflation drivers, another approach (pioneered by Adam Shapiro at the San Francisco Fed) excels at identifying demand-based drivers. This metric shows a cooling over the last year, though it is not yet back to the pre-pandemic rate.

4. Short-term inflation expectations matter, too

Pre-COVID, economists modeling inflation focused on long-term inflation expectations and downplayed the significance of short-term expectations. No longer.

Economists had assumed that movements in short-term inflation expectations often reflect commodity price swings, and that central bankers would mostly ignore these measures when setting monetary policy. Long-term inflation expectations, on the other hand, signaled whether consumer, business and investor expectations were anchored at central banks’ 2% target.

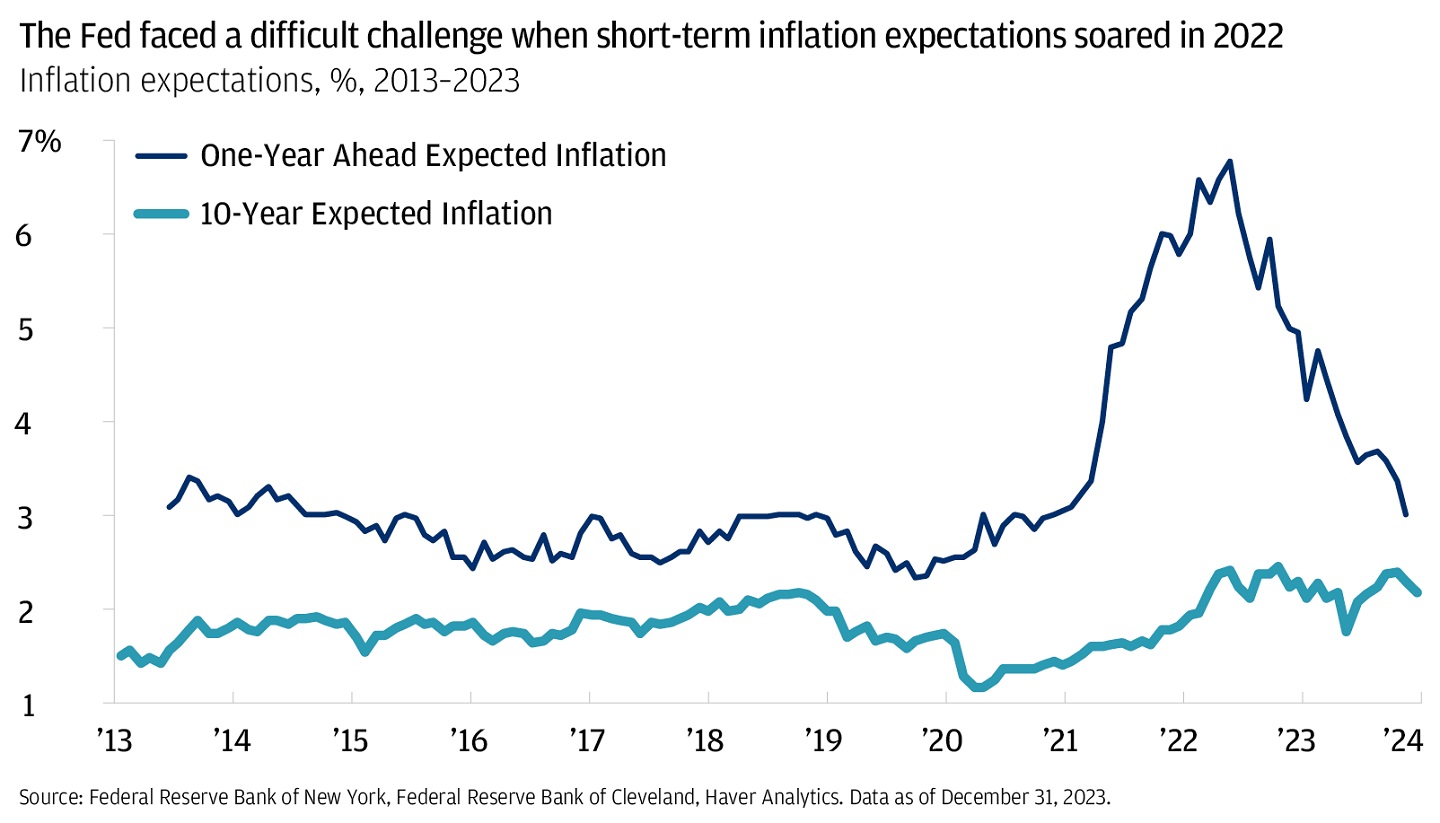
But in 2022, central banks faced a tough test. Long-term inflation expectations suggested that inflation would not spiral out of control. Yet short-term inflation expectations soared to multiples of the 2% central bank target.6

In response, central banks recalibrated. Fed Chair Jerome Powell argued in 2022 that seemingly anchored long-term inflation expectations could start to shift higher if realized inflation stayed too high for too long.7 At the time, high realized inflation was driving uncomfortably high measures of short-term inflation expectations.8

Lesson learned: Economists must now pay closer attention to short-term inflation expectation measures.9

The chart describes the one-year ahead and 10-year ahead expected inflation in percent.

5. Energy shocks sting, especially outside the United States

That energy shocks matter much more in economies beyond the United States and Canada is a longstanding, well understood trend. But the COVID experience revealed how powerfully those shocks can pass through to non-energy inflation.

Germany’s case is dramatic. The estimated passthrough excluding the pandemic is statistically indistinguishable from zero, but the measure jumps markedly when pandemic-era data is included. After Russia invaded Ukraine, Germany halted the Nord Stream pipeline project that brought Russian natural gas to Germany. The disruption caused unprecedented energy price spikes.10

The episode reminds us that historical data can fail to predict a country’s vulnerability to a novel shock.

Inflation outlook: The worst is behind us

Finally, post-COVID we better understand how inflation captures people’s attention in a nonlinear fashion. Here’s what we mean by nonlinear: When inflation falls below some threshold, the general public and market participants do not perceive it to be a problem. But once inflation rises above that threshold, it quickly becomes alarming – and often a dominant factor in market performance.

For U.S. inflation, that threshold appears to be 3%. If inflation remains at or below 3%, we expect inflation to fade as a dominant driver of market returns.

Some market participants worry that inflation could re-accelerate in 2025, following Fed rate cuts in 2024 and a possible pickup in shelter inflation. We acknowledge the risk, but it’s not our base case. On the geopolitical front, the fluid and tense situation in the Middle East presents a distinct risk to the inflation outlook, particularly from the perspective of defense spending. Yet absent another major military shock impacting the global economy, we expect inflation will remain below 3% through 2025.

Inflation is a critical economic variable, and anticipating its path is, necessarily, a challenge. Our approach to inflation modeling is not radically new. But we know more about inflation than we did in 2018 and 2019, and we think our analysis is now more refined. We hope this revised framework helps our clients in building investment portfolios for a variety of inflationary regimes.

References

1.

Source: BLS, Haver Analytics. Data as of 2020. We prefer the word “temporary” over “transitory” in describing the recent inflation shock because in 2021–22, the latter carried a specific meaning: that central banks wouldn’t hike aggressively to bring pandemic-driven inflation back down to target. In this context, the transitory narrative was wrong.

2.

Sources: BLS, BEA, Haver Analytics. Data as of December 31, 2023. The main reason shelter carries a higher weight in CPI than in PCE: PCE weights are determined by actual consumer spending, whereas CPI weights are determined by surveys that ask consumers to self-report what they regularly spend on a variety of items.

3.

Brian Adams, Lara Lowenstein, Hugh Montag et al., “Disentangling Rent Index Differences: Data, Methods and Scope,” BLS Working Paper 555, U.S. Bureau of Labor Statistics, October 6, 2022.

4.

One caveat: New tenant rent indexes are highly susceptible to end-of-sample revisions, since housing units in the full sample are surveyed only every six months. As a result, shelter inflation projections based on new tenant rents need to be continually monitored and updated when revisions occur.

5.

That the GSCPI can capture these specific sector shocks effectively at the macro level is promising, as it would not make sense for macroeconomists to include a variety of sector-specific variables in inflation models.

6.

Source: Bloomberg Finance L.P. Data as of 2022.

7.

Jerome H. Powell, “Monetary Policy and Price Stability,” Speech at economic policy symposium, Jackson Hole, Wyoming, August 26, 2022.

8.

Moreover, a circularity likely exists between short- and long-term inflation expectations: During a period of high inflation, long-term expectations could very well be anchored because consumers and businesses expect central banks to hike aggressively to bring inflation back to target.

9.

One nuance here: In 2011, amid a commodity price surge, the Fed ignored rising measures of short-term inflation expectations and didn’t hike interest rates. The likely key difference between 2022 and then: In 2011, the labor market was weak—far from conventional estimates of full employment. Thus we conclude that short-term inflation expectations are more or less important depending on other economic variables. If the labor market is at or near full employment, we believe it is important to closely track these expectations. Finally, we note that the European Central Bank (ECB), unlike the Fed, did hike interest rates twice in 2011. Yet those two rate hikes were very likely a policy mistake, one the ECB reversed in late 2011.

10.

Sources: Congressional Research Service, Haver Analytics. Data as of March 2022.

Connect with a Wealth Advisor

Our Wealth Advisors begin by getting to know you personally. To get started, tell us about your needs and we’ll reach out to you.

Connect now


IMPORTANT INFORMATION

This material is for informational purposes only, and may inform you of certain products and services offered by J.P. Morgan’s wealth management businesses, part of JPMorgan Chase & Co. (“JPM”). Products and services described, as well as associated fees, charges and interest rates, are subject to change in accordance with the applicable account agreements and may differ among geographic locations. Not all products and services are offered at all locations. If you are a person with a disability and need additional support accessing this material, please contact your J.P. Morgan team or email us at accessibility.support@jpmorgan.com for assistance. Please read all Important Information.


GENERAL RISKS & CONSIDERATIONS
Any views, strategies or products discussed in this material may not be appropriate for all individuals and are subject to risks. Investors may get back less than they invested, and past performance is not a reliable indicator of future results. Asset allocation/diversification does not guarantee a profit or protect against loss. Nothing in this material should be relied upon in isolation for the purpose of making an investment decision. You are urged to consider carefully whether the services, products, asset classes (e.g. equities, fixed income, alternative investments, commodities, etc.) or strategies discussed are suitable to your needs. You must also consider the objectives, risks, charges, and expenses associated with an investment service, product or strategy prior to making an investment decision. For this and more complete information, including discussion of your goals/situation, contact your J.P. Morgan representative.

NON-RELIANCECertain information contained in this material is believed to be reliable; however, JPM does not represent or warrant its accuracy, reliability or completeness, or accept any liability for any loss or damage (whether direct or indirect) arising out of the use of all or any part of this material. No representation or warranty should be made with regard to any computations, graphs, tables, diagrams or commentary in this material, which are provided for illustration/reference purposes only. The views, opinions, estimates and strategies expressed in this material constitute our judgment based on current market conditions and are subject to change without notice. JPM assumes no duty to update any information in this material in the event that such information changes. Views, opinions, estimates and strategies expressed herein may differ from those expressed by other areas of JPM, views expressed for other purposes or in other contexts, and this material should not be regarded as a research report. Any projected results and risks are based solely on hypothetical examples cited, and actual results and risks will vary depending on specific circumstances. Forward-looking statements should not be considered as guarantees or predictions of future events.

Nothing in this document shall be construed as giving rise to any duty of care owed to, or advisory relationship with, you or any third party. Nothing in this document shall be regarded as an offer, solicitation, recommendation or advice (whether financial, accounting, legal, tax or other) given by J.P. Morgan and/or its officers or employees, irrespective of whether or not such communication was given at your request. J.P. Morgan and its affiliates and employees do not provide tax, legal or accounting advice. You should consult your own tax, legal and accounting advisors before engaging in any financial transactions.

Legal Entity and Regulatory Information.

J.P. Morgan Wealth Management is a business of JPMorgan Chase & Co., which offers investment products and services through J.P. Morgan Securities LLC (JPMS), a registered broker-dealer and investment adviser, member FINRA and SIPC. Insurance products are made available through Chase Insurance Agency, Inc. (CIA), a licensed insurance agency, doing business as Chase Insurance Agency Services, Inc. in Florida. Certain custody and other services are provided by JPMorgan Chase Bank, N.A. (JPMCB). JPMS, CIA and JPMCB are affiliated companies under the common control of JPMorgan Chase & Co. Products not available in all states.

Bank deposit accounts and related services, such as checking, savings and bank lending, are offered by JPMorgan Chase Bank, N.A. Member FDIC.

This document may provide information about the brokerage and investment advisory services provided by J.P. Morgan Securities LLC (“JPMS”). The agreements entered into with JPMS, and corresponding disclosures provided with respect to the different products and services provided by JPMS (including our Form ADV disclosure brochure, if and when applicable), contain important information about the capacity in which we will be acting. You should read them all carefully. We encourage clients to speak to their JPMS representative regarding the nature of the products and services and to ask any questions they may have about the difference between brokerage and investment advisory services, including the obligation to disclose conflicts of interests and to act in the best interests of our clients.

J.P. Morgan may hold a position for itself or our other clients which may not be consistent with the information, opinions, estimates, investment strategies or views expressed in this document.  JPMorgan Chase & Co. or its affiliates may hold a position or act as market maker in the financial instruments of any issuer discussed herein or act as an underwriter, placement agent, advisor or lender to such issuer.